


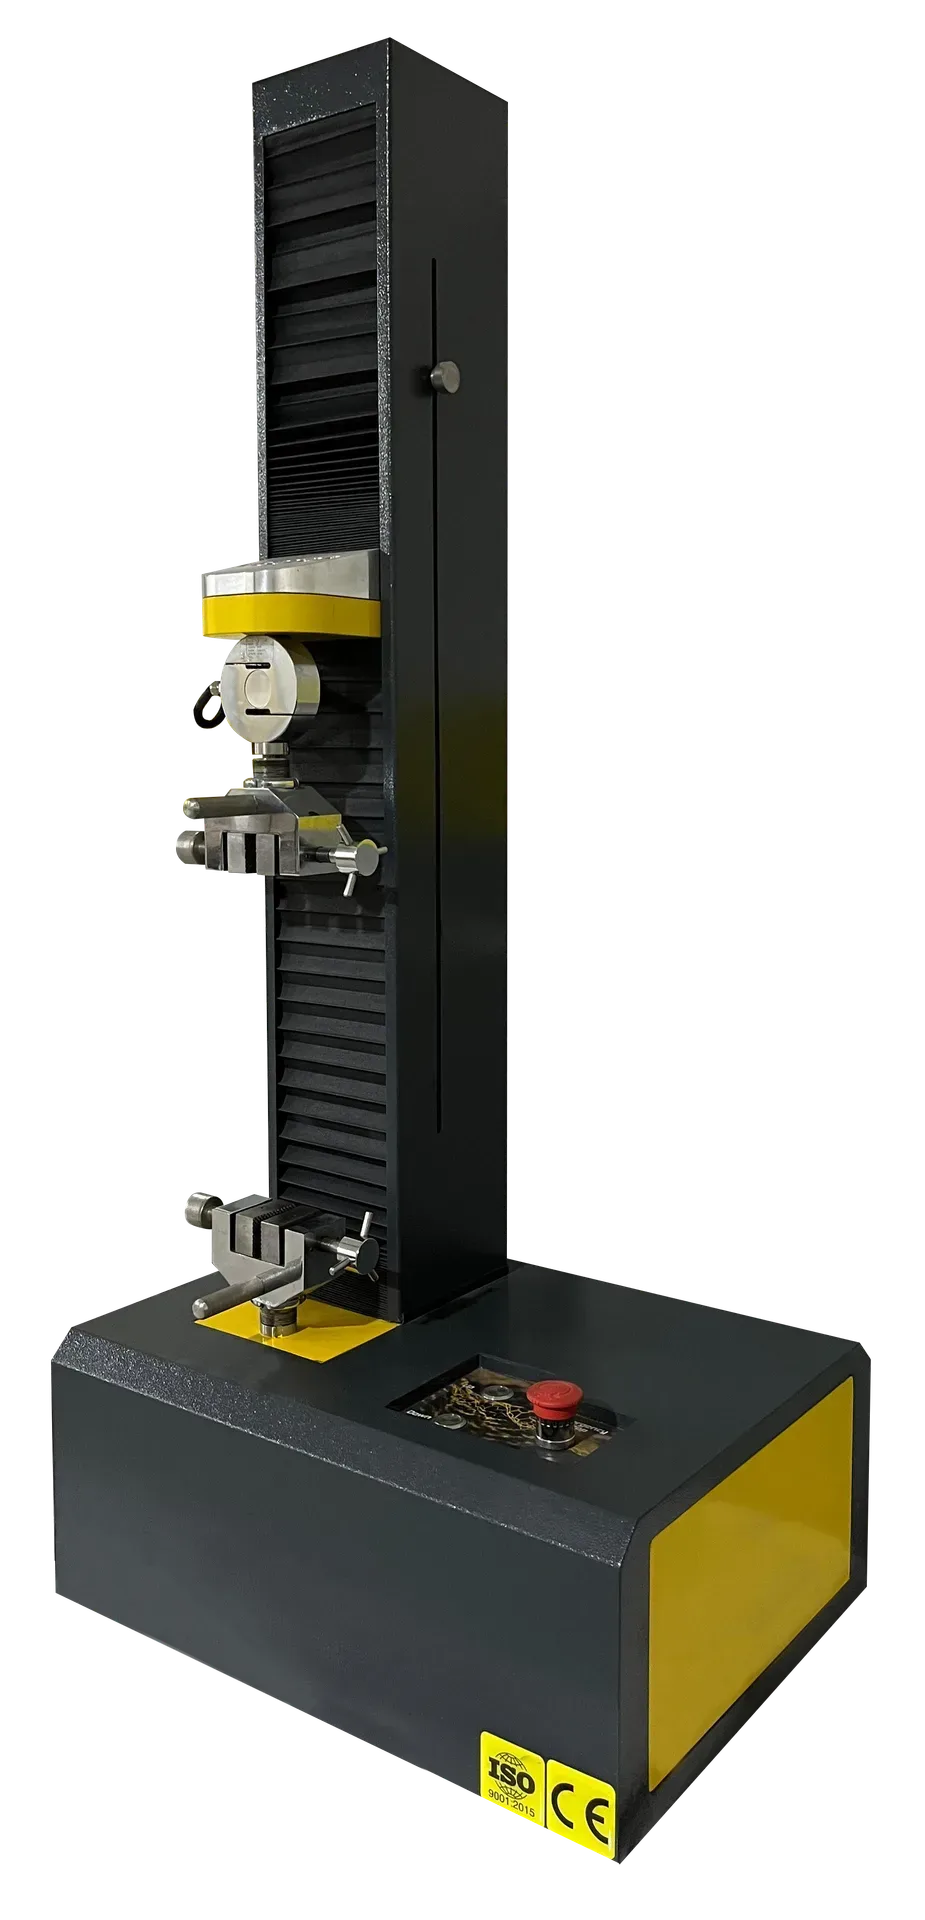
Benchtop Universal Testing Machine (0.5–2 kN)
Vector Tesla Series single-column benchtop universal testing machine for high-precision, low-force material testing — ASTM E4 / ISO 7500-1 Class 0.5.
- iso-7500-1
- astm-e4
- +3 more
View details →
Stress at a specified plastic strain offset on the engineering stress–strain curve when a distinct yield point is absent; Rp0.2 at 0.2% offset is the most common metals reporting convention.
Stress at a specified plastic strain offset on the engineering stress–strain curve when a distinct yield point is absent; Rp0.2 at 0.2% offset is the most common metals reporting convention.
Formula
Rp0.2 at εp = 0.2%
A line parallel to the elastic modulus intersects the curve at 0.2% plastic strain; the stress at that intersection is proof strength per ISO 6892-1 / ASTM E8.
Proof stress reports the onset of plastic deformation when the stress–strain curve has no sharp yield knee. Laboratories specify an offset strain (typically 0.2% plastic strain) and read the intersecting stress as Rp0.2.
A tensile specimen is loaded in a universal testing machine with an extensometer on the gauge length. Software or manual analysis draws the offset line parallel to the elastic slope and records proof stress at the intersection.
ISO 6892-1 and ASTM E8 define offset proof strengths (Rp0.1, Rp0.2, and others). Report the offset used, strain rate, and specimen geometry because proof stress is rate- and geometry-sensitive.
Machine compliance at low force, grip slippage, and misaligned extensometers inflate apparent proof stress. Using the wrong offset for spring or aerospace alloys can misstate elastic design limits.
Vector Tesla Series single-column benchtop universal testing machine for high-precision, low-force material testing — ASTM E4 / ISO 7500-1 Class 0.5.
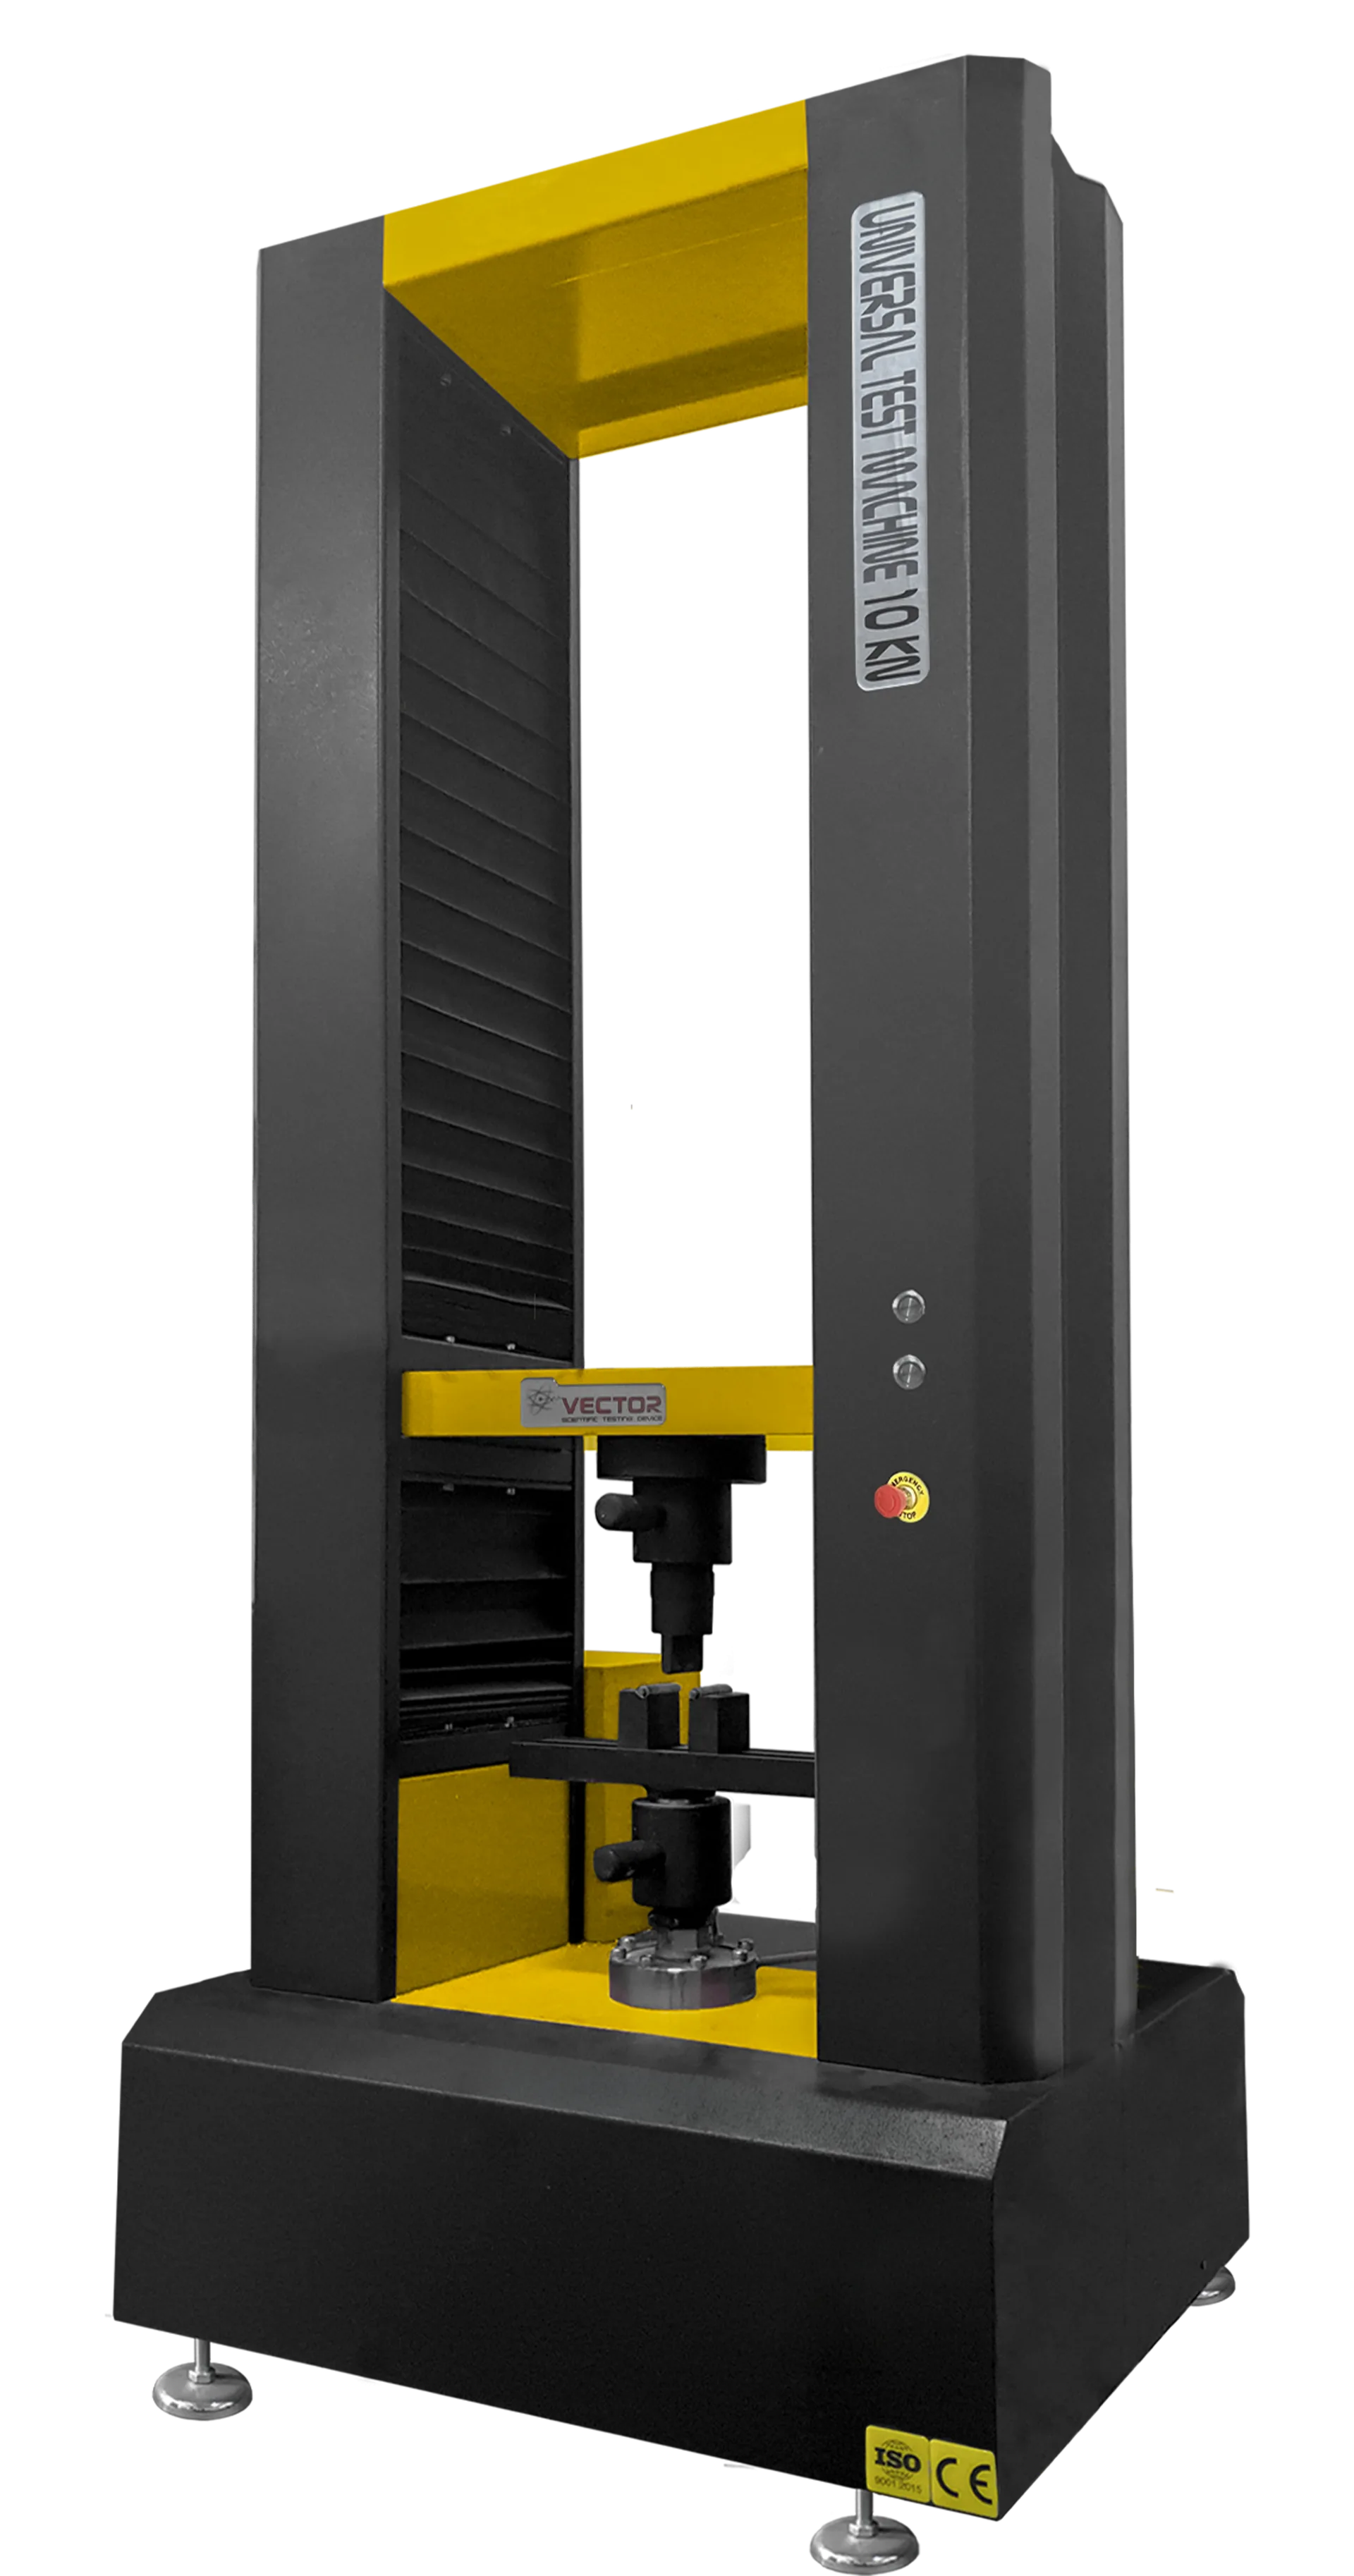
Vector Tesla Series dual-column floor-standing universal testing machine for industrial QA and R&D at 5–50 kN — ASTM E4 / ISO 7500-1 Class 0.5.
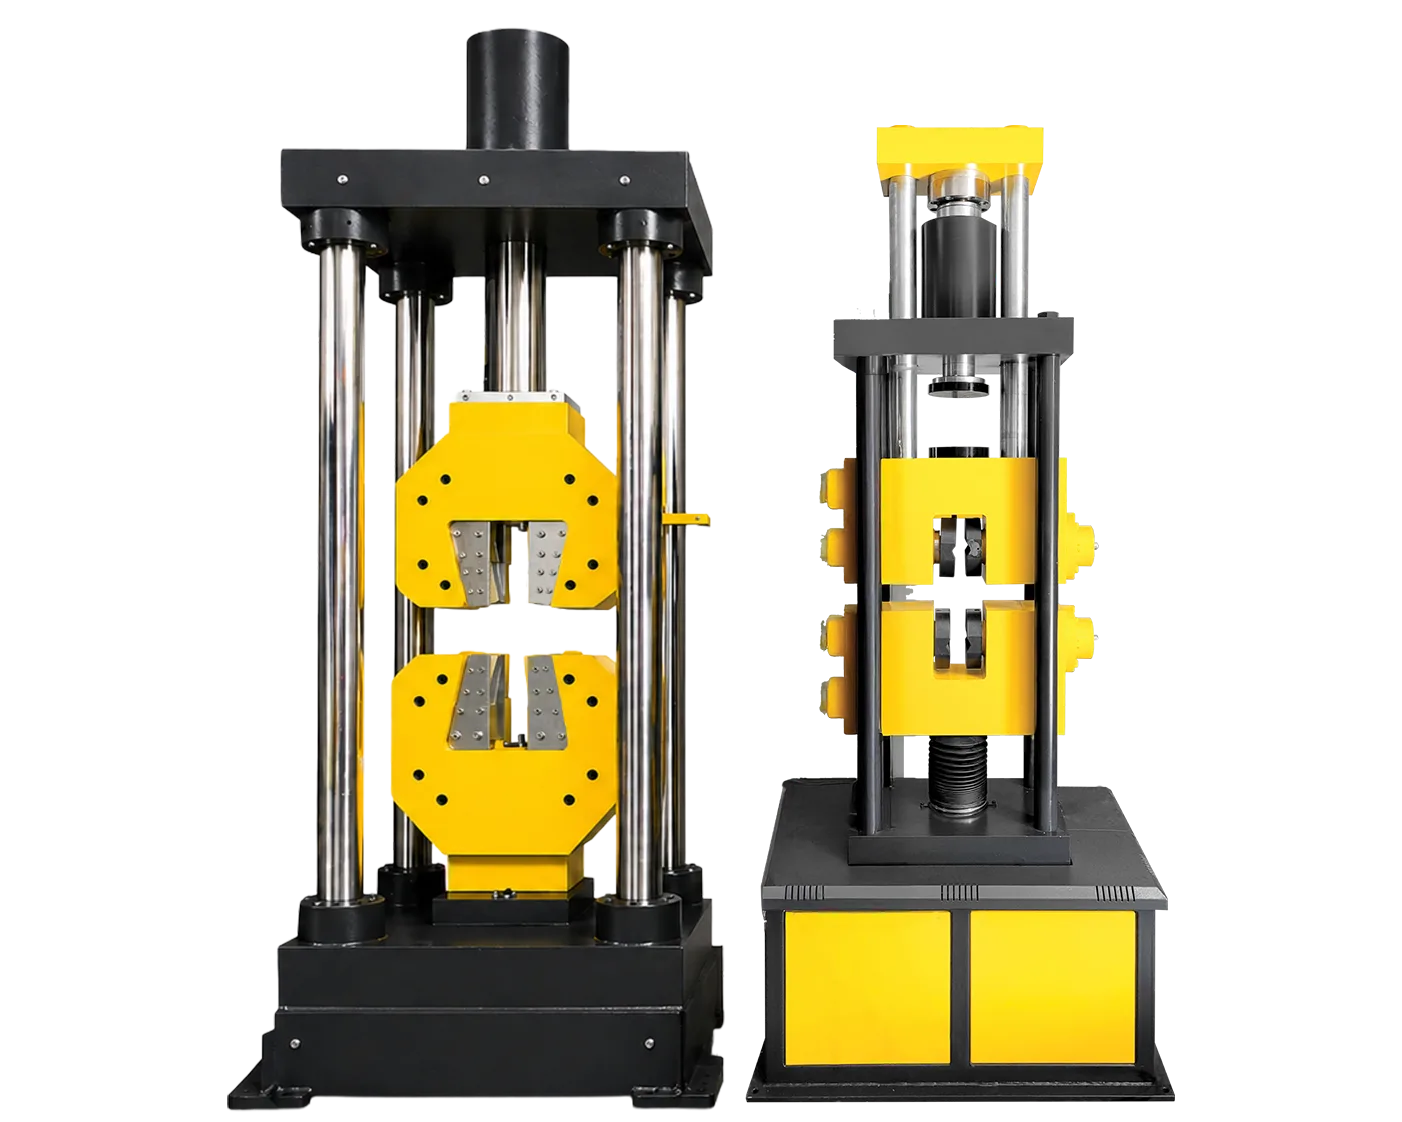
Vector Tesla Series VTR-50 servo-hydraulic UTM — 300 to 5000 kN for tensile, compression and flexural testing on metals, concrete and structural composites.
Compute yield strength Rp, tensile strength Rm, elongation A, and optional reduction of area Z from force and geometry inputs.
Open calculator →Yield Strength
The stress at which a material begins to deform plastically under monotonic loading; metals are often reported as Rp0.2 using the 0.2% plastic strain offset on the engineering stress–strain curve.
Stress–Strain Curve
The graph of stress versus strain in a tensile or compression test; engineering curves use original area A0, while true curves use instantaneous area and reveal continued hardening after necking.
Ultimate Tensile Strength
Maximum engineering stress σUTS = Fmax/A0 reached in a monotonic tensile test, also called tensile strength Rm in ISO metals vocabulary; necking causes true stress to exceed engineering stress afterward.