


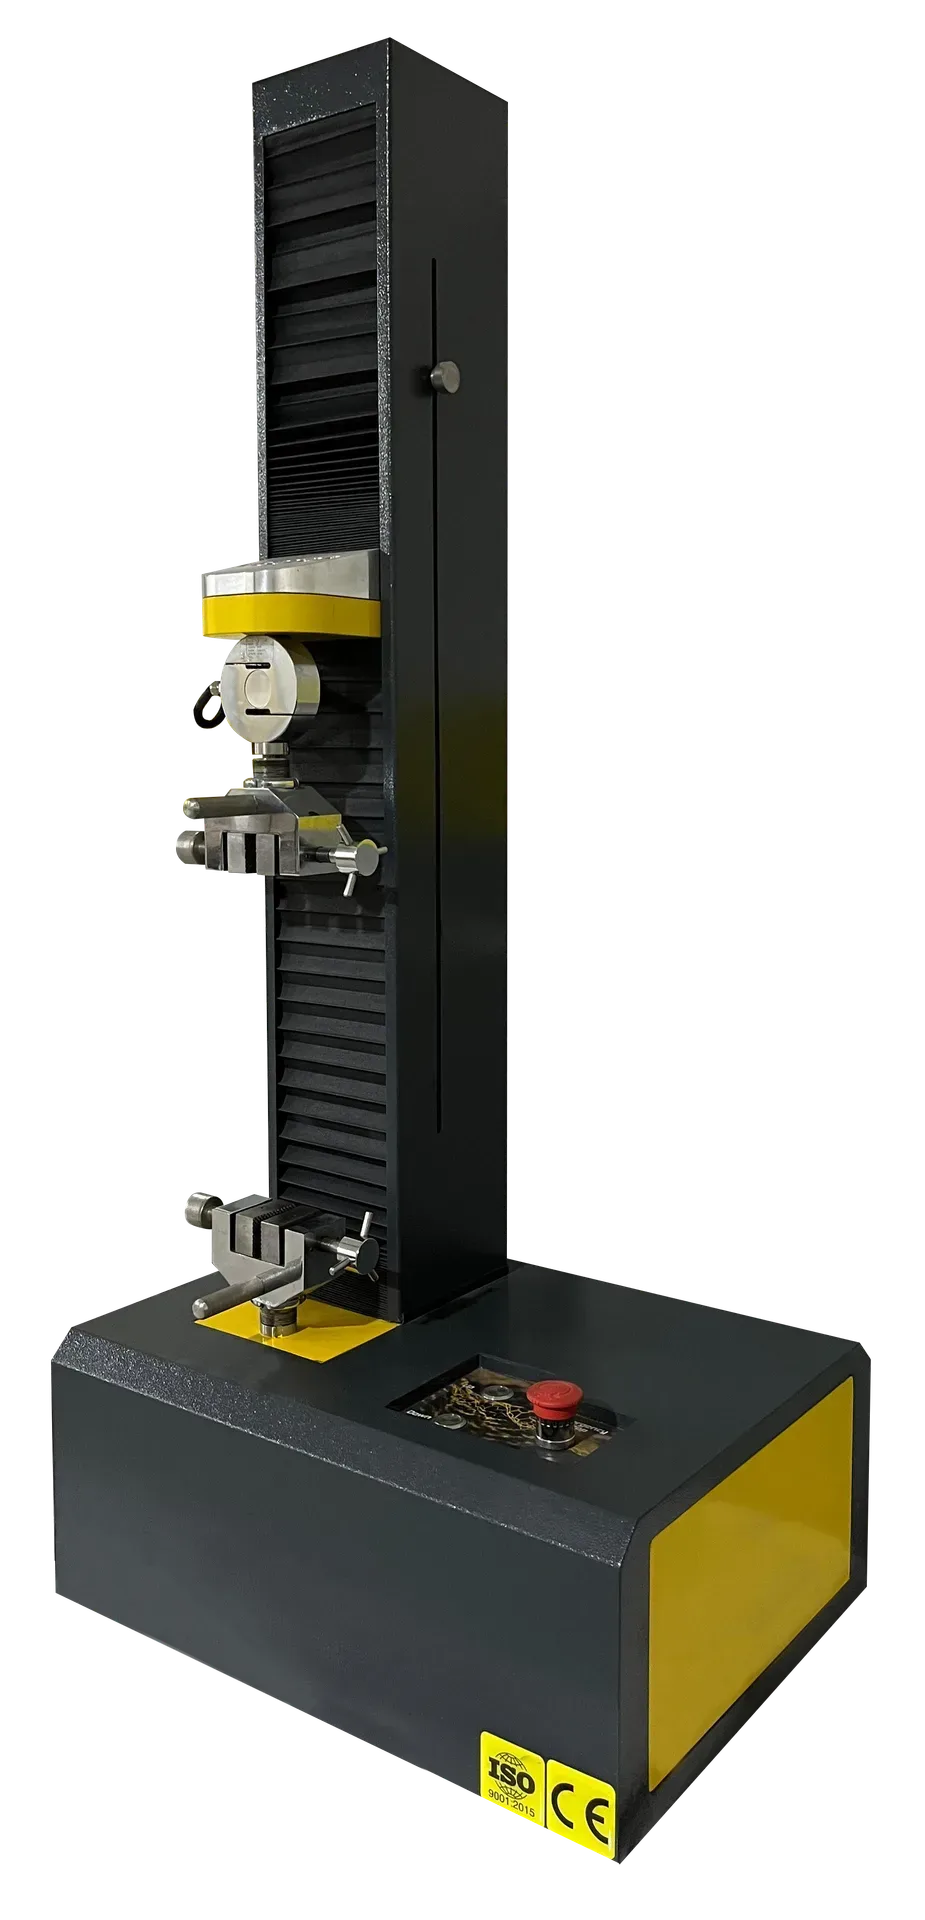
Benchtop Universal Testing Machine (0.5–2 kN)
Vector Tesla Series single-column benchtop universal testing machine for high-precision, low-force material testing — ASTM E4 / ISO 7500-1 Class 0.5.
- iso-7500-1
- astm-e4
- +3 more
View details →
The graph of stress versus strain in a tensile or compression test; engineering curves use original area A0, while true curves use instantaneous area and reveal continued hardening after necking.
The graph of stress versus strain in a tensile or compression test; engineering curves use original area A0, while true curves use instantaneous area and reveal continued hardening after necking.
Formula
σeng = F/A0 , εeng = ΔL/L0
Engineering stress and strain relate force F and elongation ΔL to original cross-section A0 and gauge length L0. True stress σtrue = F/A and true strain integrates dL/L for large deformations.
A stress–strain curve is the fundamental record of how a material resists deformation from elastic loading through yielding, strain hardening, necking, and fracture. The engineering curve—force divided by original area—is convenient for specification testing and drops after UTS when necking reduces load despite rising true stress in the neck.
The initial linear elastic segment yields Young’s modulus and proportional limit. Yielding marks the onset of measurable plasticity; proof strengths like Rp0.2 operationalize yield for gradual-yielding materials. The strain-hardening region shows increasing flow stress as dislocation density rises.
Necking begins when the strain-hardening rate can no longer compensate for area loss under constant engineering stress definitions. Toughness (energy to fracture) is the area under the engineering curve up to fracture when plotted in stress–strain space with appropriate units.
Digital acquisition at adequate sampling rate captures serrations (Portevin–Le Chatelier) in some alloys and helps detect instrumentation anomalies such as slip or resonance.
Vector Tesla Series single-column benchtop universal testing machine for high-precision, low-force material testing — ASTM E4 / ISO 7500-1 Class 0.5.
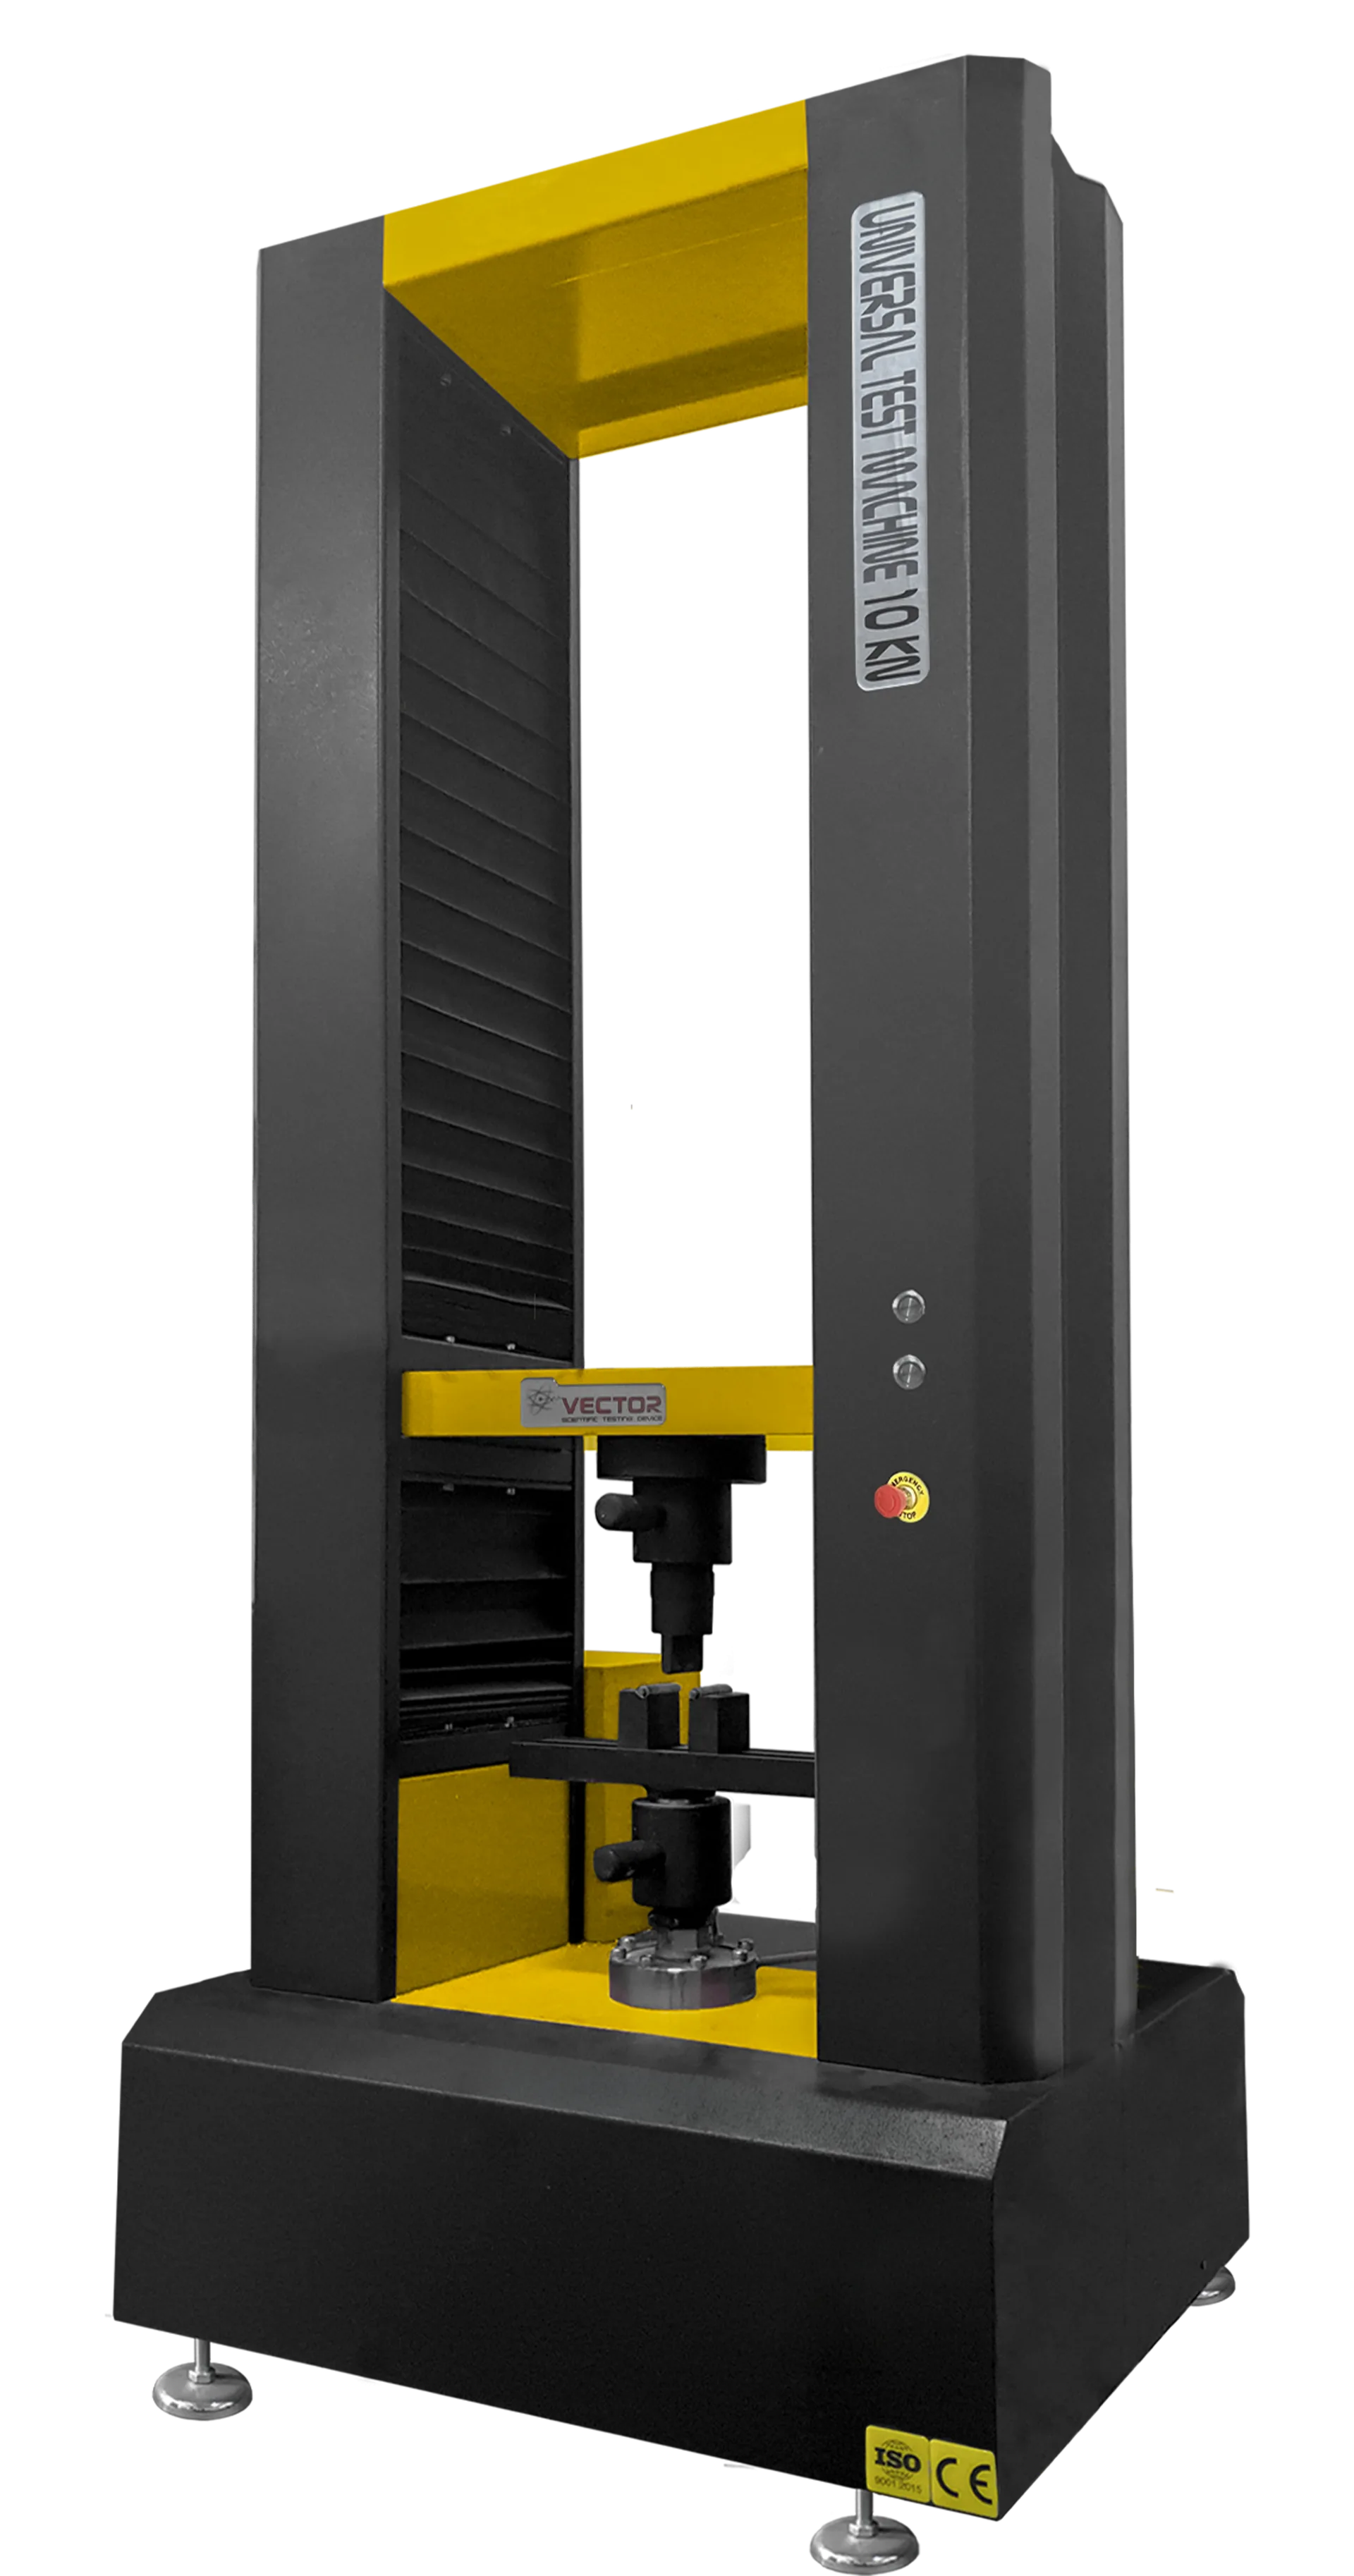
Vector Tesla Series dual-column floor-standing universal testing machine for industrial QA and R&D at 5–50 kN — ASTM E4 / ISO 7500-1 Class 0.5.
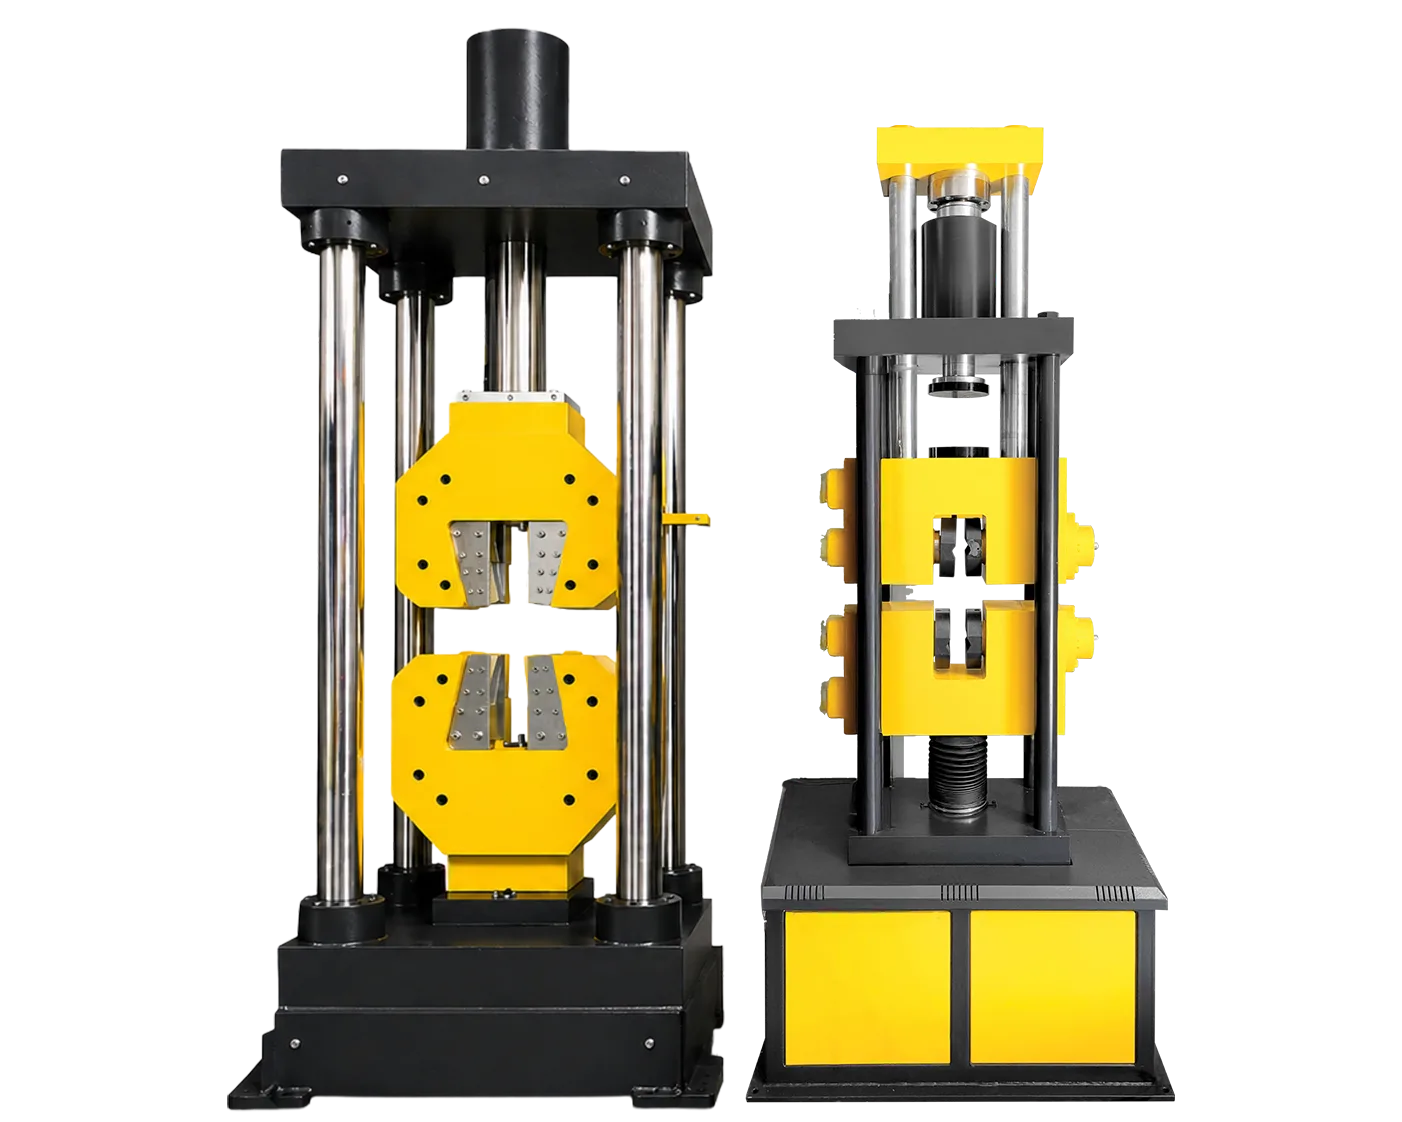
Vector Tesla Series VTR-50 servo-hydraulic UTM — 300 to 5000 kN for tensile, compression and flexural testing on metals, concrete and structural composites.
Compute yield strength Rp, tensile strength Rm, elongation A, and optional reduction of area Z from force and geometry inputs.
Open calculator →Yield Strength
The stress at which a material begins to deform plastically under monotonic loading; metals are often reported as Rp0.2 using the 0.2% plastic strain offset on the engineering stress–strain curve.
Ultimate Tensile Strength
Maximum engineering stress σUTS = Fmax/A0 reached in a monotonic tensile test, also called tensile strength Rm in ISO metals vocabulary; necking causes true stress to exceed engineering stress afterward.
Young's Modulus
The proportionality constant E between uniaxial stress and elastic strain in Hooke's regime (σ = Eε); slope of the initial linear region on a stress–strain curve for isotropic materials.